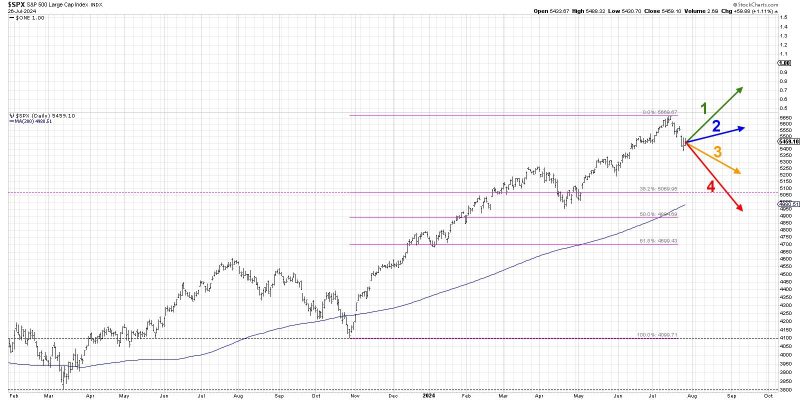
This week saw the major equity averages continue a confirmed pullback phase, with some of the biggest gainers in the first half of 2024 logging some major losses. Is this one of the most buyable dips of the year? Or is this just the beginning of a protracted decline with much more pain to come for investors?
Today, we’ll walk through four potential outcomes for the S&P 500 index over the next six to eight weeks. As I share each of these four future paths, I’ll describe the market conditions that would likely be involved, and I’ll also share my estimated probability for each scenario.
By the way, we conducted a similar exercise for the S&P 500 back in April, and you may be surprised to see which scenario actually played out!
And remember, the point of this exercise is threefold:
Consider all four potential future paths for the index, think about what would cause each scenario to unfold in terms of the macro drivers, and review what signals/patterns/indicators would confirm the scenario.
Decide which scenario you feel is most likely, and why you think that’s the case. Don’t forget to drop me a comment and let me know your vote!
Think about how each of the four scenarios would impact your current portfolio. How would you manage risk in each case? How and when would you take action to adapt to this new reality?
Let’s start with the most optimistic scenario, involving the S&P 500 making yet another new all-time high as the bullish trend resumes.
Option 1: The Super Bullish Scenario
Our first scenario would mean that the brief pullback phase is now over, and the S&P 500 and Nasdaq would power to new all-time highs in August. By early September, we’d be talking about the resurgence of the Magnificent 7 names, reflecting on how the markets in 2024 have diverged so much from the traditional seasonal patterns, and discussing the likelihood of the S&P finishing 2024 above the 6000 level.
Dave’s Vote: 5%
Option 2: The Mildly Bullish Scenario
What if the Magnificent 7 stocks take a backseat to other sectors, such as financials and industrials? If the value trade continues to work, as we’ve observed in the last couple weeks, we could see a scenario where lots of stocks are working well but it’s not enough to propel the equity benchmarks much higher. The S&P 500 wouldn’t see much downside in this scenario and would spend the next six to eight weeks between 5400 and 5650.
Dave’s vote: 15%
Option 3: The Mildly Bearish Scenario
How about a scenario where this pullback continues to plague the equity markets, but the pace of the decline lightens up a bit? The mega-cap growth stocks continue to struggle, but we don’t see those full risk-off signals and the VIX remains below 20. By early September, we’re down about 10% overall off the July high, but investors are licking their lips about a potential Q4 rally into year-end 2024.
Dave’s vote: 60%
Option 4: The Super Bearish Scenario
You always need to consider an incredibly bearish scenario, if only to remind yourself that it’s a possibility, even a very unlikely one! What if this pullback is just getting started, the S&P 500 fails to hold the 5000 level, and we see a break below the 200-day moving average? That would mean a similar pullback to what we experienced in August and September 2023, and while we’re talking about the potential for a Q4 rally, we’re all way more concerned that there’s even more downside to be had before it’s all said and done.
Dave’s vote: 20%
What probabilities would you assign to each of these four scenarios? Check out the video below, and then drop a comment with which scenario you select and why!
RR#6,
Dave
PS- Ready to upgrade your investment process? Check out my free behavioral investing course!
David Keller, CMT
Chief Market Strategist
StockCharts.com
Disclaimer: This blog is for educational purposes only and should not be construed as financial advice. The ideas and strategies should never be used without first assessing your own personal and financial situation, or without consulting a financial professional.
The author does not have a position in mentioned securities at the time of publication. Any opinions expressed herein are solely those of the author and do not in any way represent the views or opinions of any other person or entity.
